


TL;DR: Supply chain data shows what you shipped, not what customers wanted. This gap costs retailers $1.2 trillion annually in lost sales and drives $18 billion in food waste. Traditional forecasting systems record constrained supply as actual demand, creating a feedback loop of bad decisions. The solution requires integrating external signals (weather, traffic, competitor activity, customer sentiment) with AI that processes multiple variables simultaneously.
Core Answer
Your supply chain data reflects past biases and what you supplied, not true customer demand
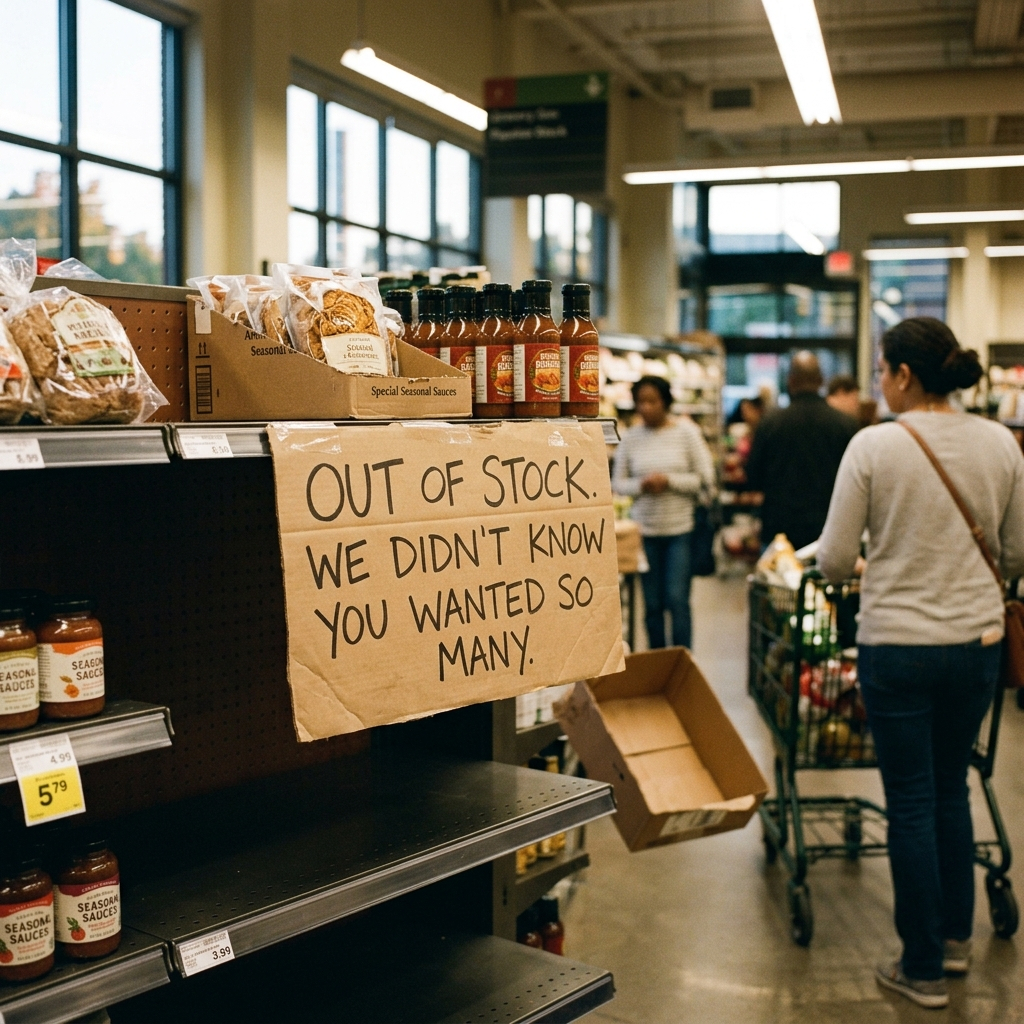
Stockouts get recorded as complete sales cycles, hiding the real demand you missed
External factors (weather, events, competition) drive 30-40% of demand variation but most systems ignore them
Inexperienced store managers guessing at orders create panic buying or massive waste
AI-powered demand sensing that integrates multiple data sources reduces forecast errors by 5-40%
We’ve watched companies make million-dollar decisions based on a fundamental lie. They stare at their supply chain dashboards, analyze the numbers, and believe they understand what customers want.
They don't.
What they're seeing is a reflection of their own past biases. Historical data showing what they shipped, not what customers actually demanded. The difference costs retailers $1.2 trillion in lost sales every year.
What Are You Actually Seeing When You Look at Supply Chain Data?
Think about a retailer who sold strong volumes of a particular winter beverage every December for five years running. Their system flags a clear pattern: stock up on black forest syrup for December.
But here's what the data doesn't show.
Three of those five years had unseasonable cold snaps that drove demand. The other two years, they ran promotions because inventory was sitting. The correlation was "December equals black forest syrup" when the reality was "unexpected cold weather equals hot beverage sales."
So they order heavy for December. This year is mild. No promotion planned. Now they're stuck with inventory going to waste.
Their data couldn't separate correlation from causation because it lacked external context. No weather data. No promotional calendar. No competitive landscape. They made decisions in a vacuum, using a rearview mirror to drive forward.
Only 35% of businesses feel confident in their inventory forecast accuracy. The median forecast error in food and beverage sits at 25%. Some scenarios reach 50% error rates.
This isn't an edge case. This is standard operating procedure across enterprise organizations.
Bottom line: Your historical data shows correlation without causation because external context (weather, promotions, competition) is missing. The median forecast error in food and beverage is 25%.
How Does AI See Demand Differently Than Human Planners?
A human planner looks at their dashboard and sees last December's sales spike. That's one data point, maybe two if they're comparing year-over-year.
AI processes something entirely different.
Weather forecasts for the next two weeks. Foot traffic patterns in that specific location. What competitors are promoting. Local events that might drive store visits. Customer sentiment from recent NPS feedback about seasonal offerings.
When it recommends inventory levels, it's not saying "December needs X units because last December sold X units."
It's saying "next week's cold front plus the holiday market downtown plus competitor stockouts plus positive buzz on your new flavor means you need Y units on Tuesday, but Z units by Friday."
The human can't hold all those variables in their head at once. They'd need dozens of spreadsheets open, manually cross-referencing everything. By the time they pieced it together, the opportunity would be gone.
The AI makes that connection instantly and adjusts the recommendation before the planner even realizes conditions have changed.
Bottom line: AI processes multiple variables (weather, traffic, events, sentiment, competition) simultaneously and adjusts recommendations in real time. Humans need dozens of spreadsheets and still miss the window.
Losing the Moment
Most people think the cost of bad forecasting is excess inventory or stockouts.
The real cost is revenue you can't recapture.
That cold front hits. Your competitor runs out of stock. Customers are primed and walking into your store. But your shelves are light because your forecast said "normal December levels."
You miss the sale entirely.
The customer walks out, goes somewhere else, tries a different product they end up preferring. Then they go back to that operator. You can't get that back with a markdown later.
But it's worse than just lost revenue.
You're losing trust. Customers remember when you didn't have what they wanted. And you're losing the data about what true demand actually was.
Your system records "we sold what we had in stock" not "we could have sold three times that amount." Next year's forecast is based on constrained supply, not actual demand.
It's a compounding problem.
Meanwhile, your competitor who did have stock? They captured data about real demand, built customer loyalty, and their system learned the right lesson.
Speed isn't just about efficiency. It's about capturing opportunities that exist for maybe 48 hours and then vanish forever.
Why Do Stockouts Create a Vicious Forecasting Cycle?
When products stock out, systems record constrained supply as if it were actual demand. This creates a feedback loop where next year's forecast is based on what you failed to sell rather than what customers wanted.
This happens everywhere. In food and beverage especially, it's the norm.
It gets worse when store managers themselves are responsible for ordering. Some haven't even been through one full cycle. They've never seen a summer rush or a holiday spike.
They should be supporting customers, not playing forecasting analyst with spreadsheets they barely understand.
What the Carnage Looks Like
You get panic ordering or massive under-ordering. No middle ground.
New manager sees a busy Saturday, freaks out, and orders like every day is going to be that Saturday. Now you've got dairy expiring, fresh ingredients going bad, thousands in waste.
Or the flip side.
They're conservative, don't want to over-order, and then the weekend hits. They're completely cleaned out by noon. Customers are furious. Staff is stressed trying to explain why half the menu isn't available. The manager is on the phone desperately trying to get emergency deliveries that cost twice as much.
Here's the worst part: they have no idea what they should have ordered because they don't know what normal looks like yet.
They can't tell if last Tuesday was slow because of weather, or because school was out, or because a competitor opened nearby. They're guessing based on gut feel and whatever their regional manager told them, which is probably based on some other location's data that doesn't even apply.
This is happening in huge enterprises. Companies that promise perpetual inventory - one of everything left right up to closing.
Bottom line: Systems record what you sold (constrained supply) as complete demand. Next year's forecast uses that flawed data. The cycle repeats. Inexperienced managers amplify the problem.
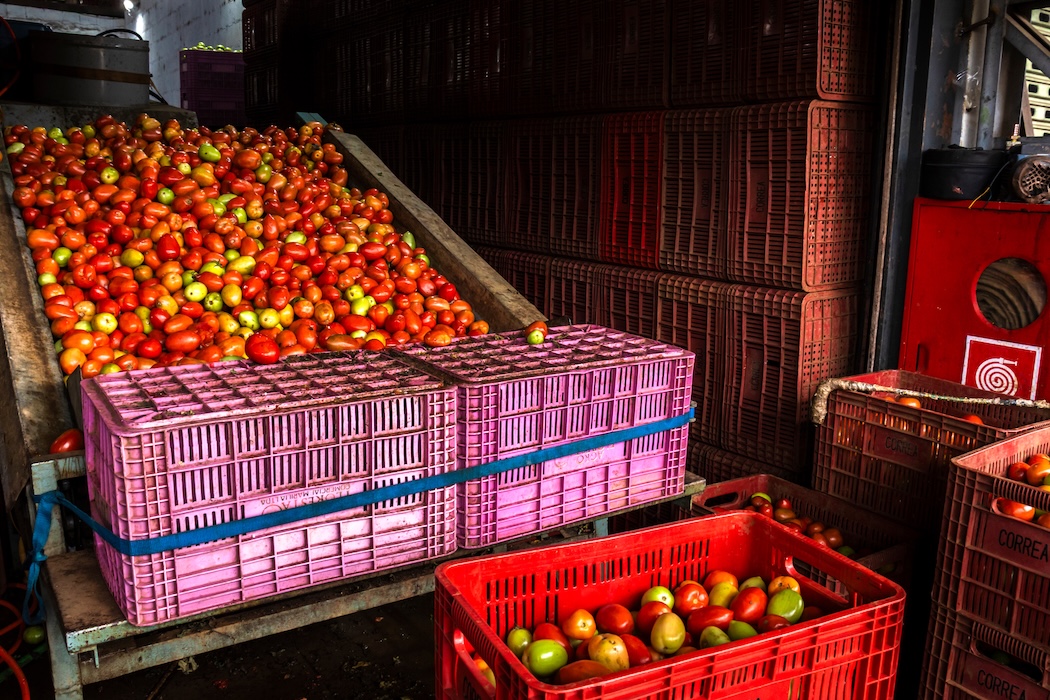
How Much Does Poor Forecasting Cost in Food Waste?
Poor demand forecasting drives 10% overproduction in food supply chains. U.S. grocery retailers waste $18 billion of food every year.
That's double the industry's entire profit margin.
Between 30-40% of the U.S. food supply is wasted annually. Inadequate demand forecasting is a root cause. Studies show that improved forecasting tools could reduce food waste by up to 28% in commercial kitchens.
Companies promise perpetual inventory, but that creates impossible tension. How do you maintain one of everything until closing without creating massive waste, especially when inexperienced managers are guessing at demand?
You need good AI. Good stock handling processes. Ways to get rid of excess at the end of the day - charities, for example. The right software can sort that out from a stock and notification perspective.
As a B-Corp, reducing food waste in global supply chains is part of our mission. Bad forecasting undermines that mission every single day.
Bottom line: Poor forecasting drives 10% overproduction. U.S. grocery retailers waste $18 billion annually (double the industry's profit margin). Improved forecasting could reduce commercial kitchen waste by 28%.
What External Signals Do Traditional Systems Miss?
Weather alone influences approximately $1 trillion in global retail sales annually. That's 3.4% of all retail sales.
Most forecasting systems ignore it entirely.
Traditional methods built on spreadsheets and historical averages fail at the edges. They can't anticipate demand spikes from heat waves. Drops from competing promotions. Supply shortfalls triggered by regional weather events three tiers up the supply chain.
These systems average the past rather than modeling the causal drivers of demand: weather patterns, local events, price elasticity, social sentiment.
Machine learning algorithms that automatically incorporate weather data reduce forecast errors by 5-15% at the product level. For weather-sensitive items, errors drop up to 40% at product group and store levels.
One retailer reduced perishable food losses by 18% simply by using weather data to adjust replenishment orders and pricing. Walmart reduced stockouts by 16% through improved planning processes, recovering a significant portion of the nearly $3 billion in potential sales they lost to out-of-stocks in 2014.
Bottom line: Weather alone influences $1 trillion in retail sales (3.4% of total). Machine learning with weather data reduces forecast errors by 5-15% overall and up to 40% for weather-sensitive products.
What's the True Cost of a Stockout?
Traditional systems measure "fill rate" - what percentage of orders you fulfilled. A 95% fill rate looks solid on a dashboard.
But if your actual sales drop 80% on out-of-stock days, that 5% gap is driving catastrophic lost revenue you're not even tracking.
For a company with $100 million in annual sales, a 92% in-stock rate and 50% spill rate translates to $4 million in annual lost sales. Revenue that vanishes into the gap between what you supplied and what customers actually wanted.
A single stockout event costs 1.5x to 3x the direct lost revenue once you factor in customer lifetime value loss, marketplace ranking damage, and emergency restock fees.
Products that experience stockouts remain unavailable for an average of 35 days. Over a month of lost sales opportunity. Plenty of time for competitors to capture displaced customers permanently.
When 43% of customers switch to competitors after encountering a stockout, you're not just losing a sale. You're losing $360 in future revenue over three years at typical purchase frequencies.
Bottom line: A single stockout costs 1.5x to 3x the direct lost revenue. Products stay out of stock for 35 days on average. When 43% of customers switch to competitors, you lose $360 in future revenue over three years.
How Do You Build AI-Powered Demand Sensing?
The human brain can't hold all the variables needed for accurate demand forecasting. You'd need dozens of spreadsheets open, manually cross-referencing weather, traffic, events, competition, customer sentiment, promotional calendars, and historical patterns.
AI adoption among small and medium-sized businesses has doubled from 23% to 48% between 2024 and 2025. Companies are desperately trying to overcome the limitations of traditional forecasting methods that fail to sense real-time market volatility.
Demand shifts. Supply changes. Lead time variations. Vendor reliability issues.
77% of businesses are investing in technology to create better supply chain visibility. Those who've implemented these solutions are twice as likely to avoid supply chain problems compared to those still relying on traditional methods.
But 29% of firms cite data silos and incompatible IT infrastructure as a major barrier. When sales, inventory, promotions, and supplier data live in different silos, forecasts miss critical context. Delayed inputs. Mismatched timeframes. Conflicting records.
Without unified, clean, and real-time data inputs, even sophisticated systems can't reliably detect demand shifts.
Bottom line: AI adoption in SMBs doubled from 23% to 48% between 2024 and 2025. But 29% of firms face data silo barriers. Without unified, real-time data, even sophisticated systems fail.
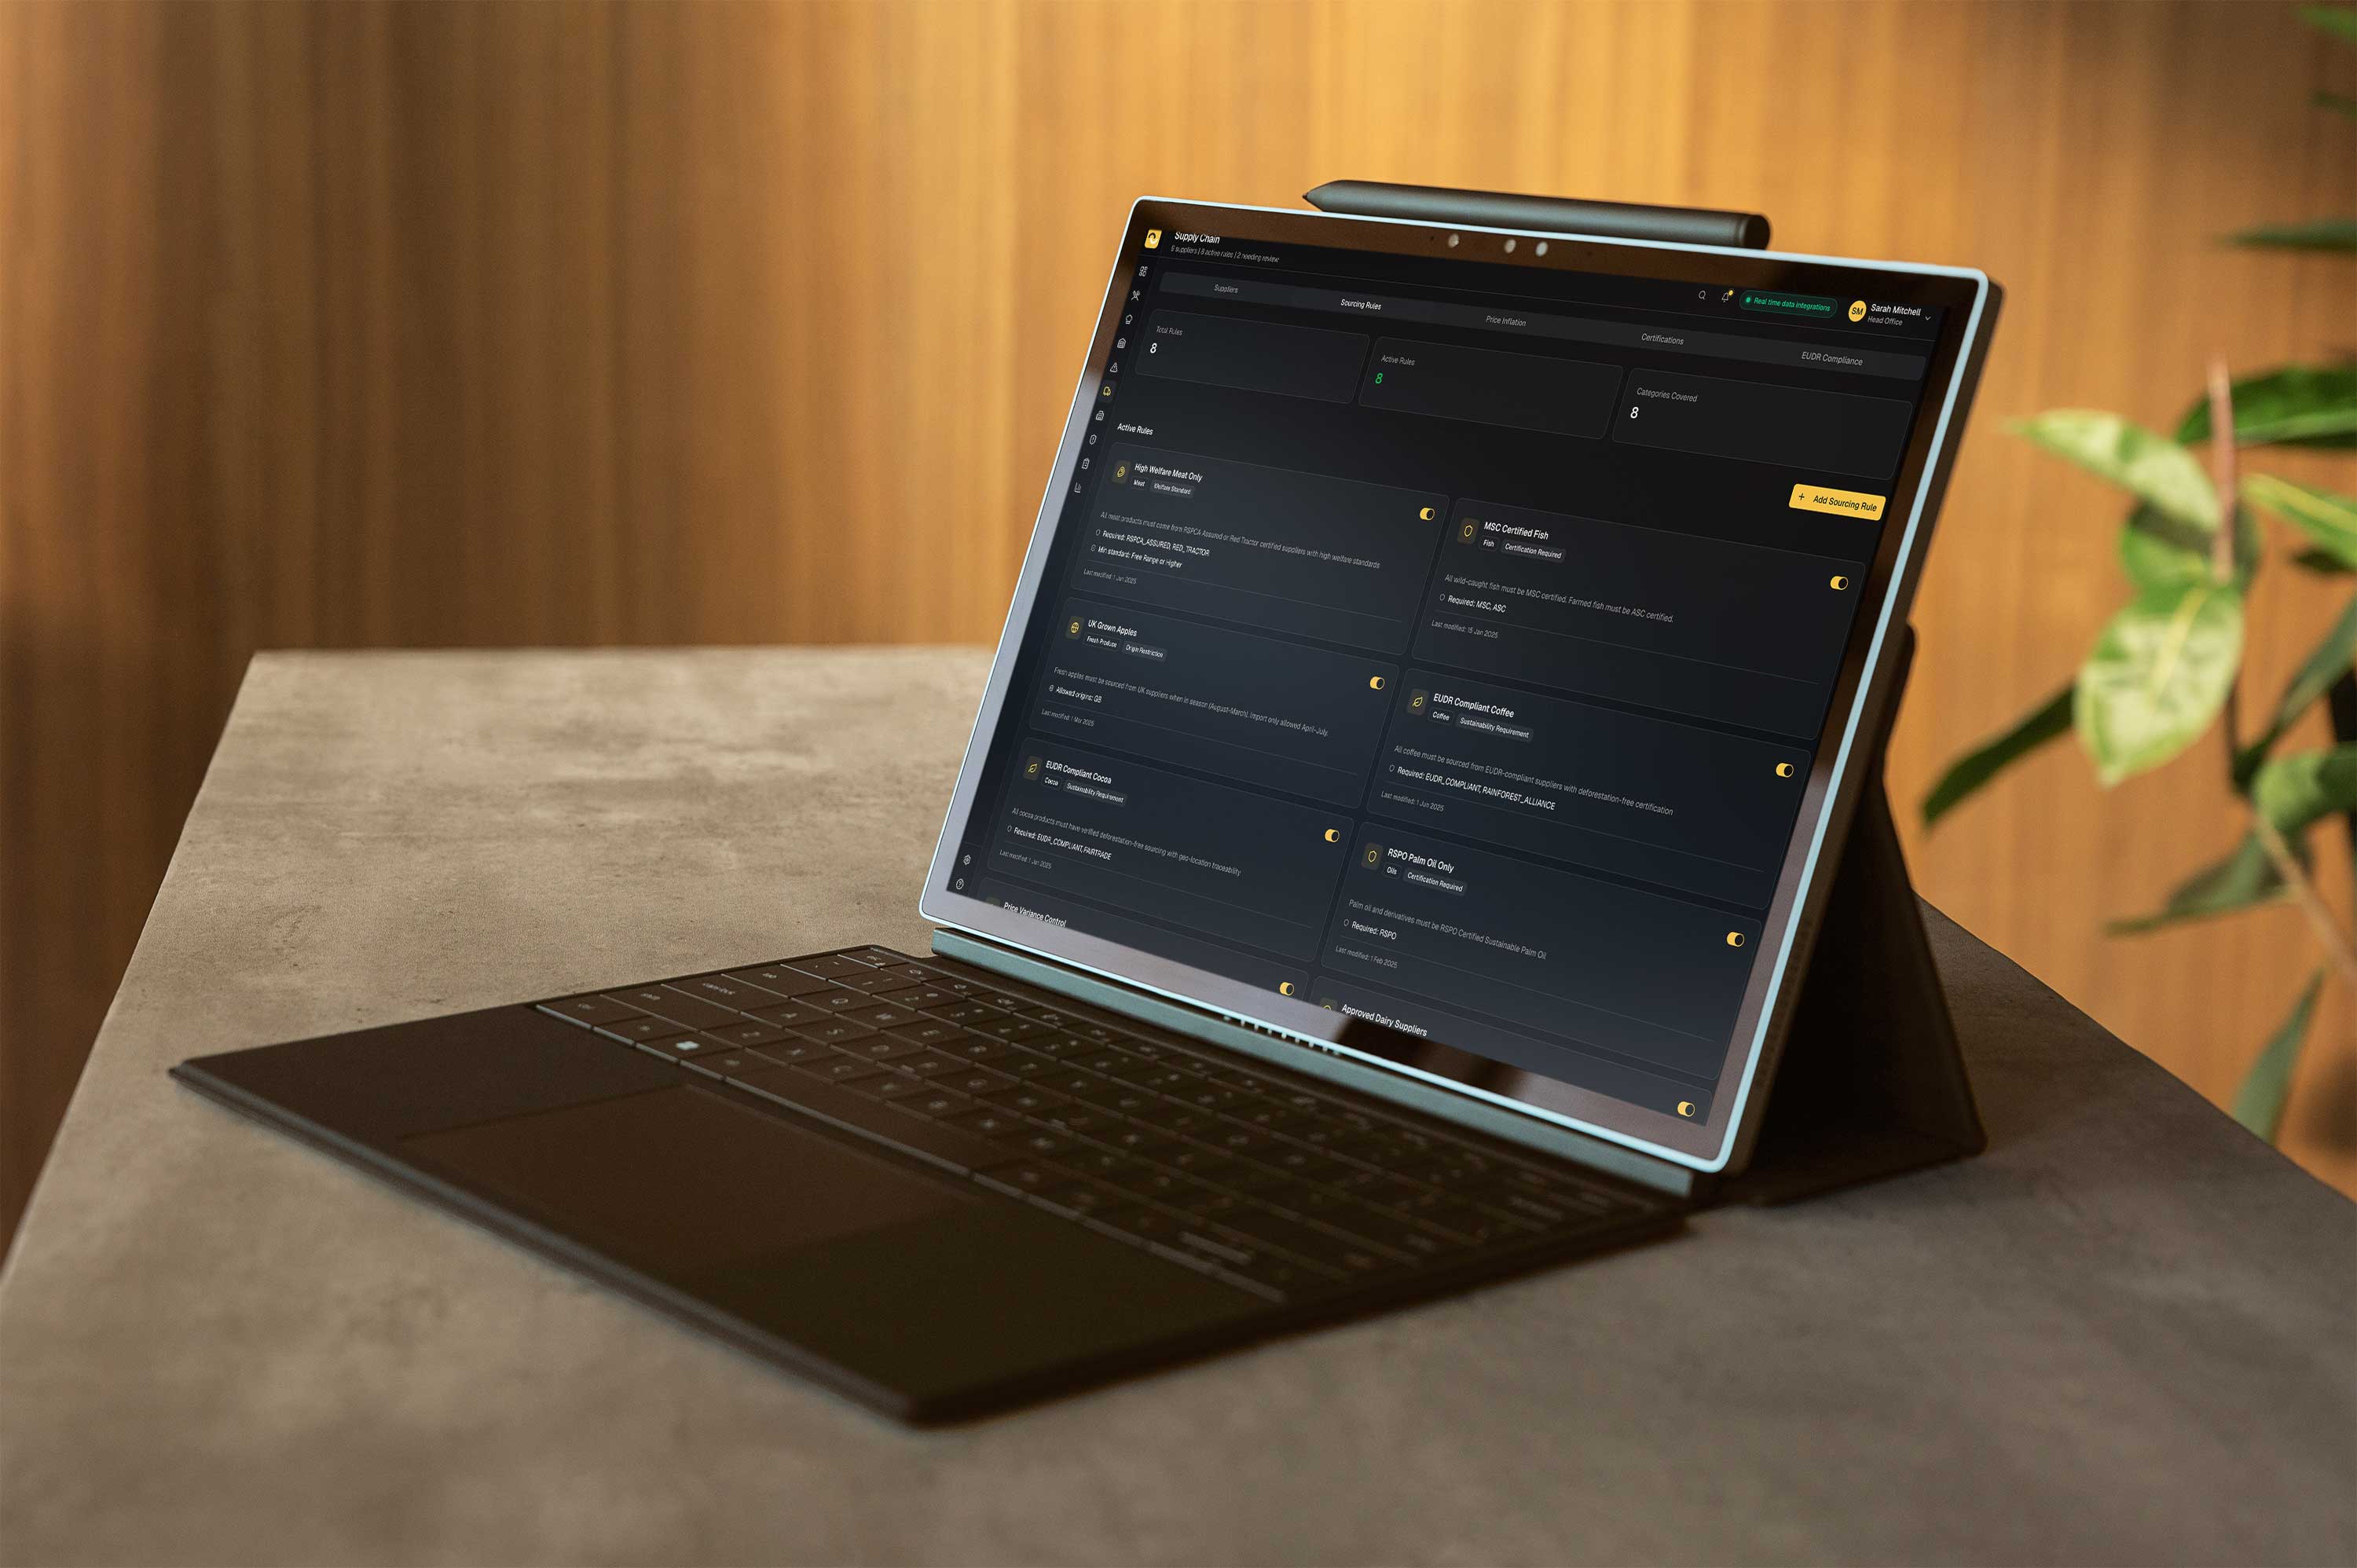
What Does True Demand Visibility Look Like?
At Orderly, we've built a multi-dimensional data model that connects disparate signals most companies never see.
Traffic patterns. Weather forecasts. Local events. Competitive activity. Customer sentiment from NPS scores and product feedback. Promotional calendars. Historical demand patterns adjusted for external context.
The system doesn't just tell you what sold last year. It tells you why it sold, what conditions drove that demand, and whether those conditions exist right now.
When a cold front is approaching, competitor inventory is low, and customer sentiment around your seasonal offering is positive, the system adjusts recommendations before the opportunity passes.
It can even manage end-of-day excess, routing surplus inventory to charities and sending notifications to the right people at the right time.
This is what demand visibility actually means. Not looking at what you shipped. Looking at what customers wanted, what external factors influenced that desire, and what's about to change.
Bottom line: True demand visibility connects traffic, weather, events, competition, sentiment, and promotions. The system tells you why something sold and whether those conditions exist now, not just what sold last year.
What Does Moving to Demand-Centric Planning Require?
Moving from supply-centric to demand-centric planning requires more than new software.
It requires admitting that your internal data is fundamentally flawed. That your historical patterns reflect your own constraints, not customer behavior. That the spreadsheet your store manager is staring at can't possibly capture the complexity of real demand.
Only 35% of businesses feel confident in their forecast accuracy. Inventory distortion - the combined cost of stockouts and overstocks - reached $1.77 trillion in 2023. That's 7.2% of all retail sales.
The companies that figure this out first will capture the moments their competitors miss. They'll build loyalty while others scramble for emergency deliveries. They'll learn the right lessons while others compound their errors year after year.
Your supply chain data isn't lying on purpose.
It's just telling you what you already did, not what customers actually wanted. And if you keep using that rearview mirror to drive forward, you'll keep missing the opportunities that matter most.


.svg)
.svg)
.svg)